BIG Triangle Breakout: This 10% Move Begins New Trend!
As the broader trend continued in Wednesday’s session with the benchmark Nifty 50 index rallying 0.49% to 22753.8, the highest closing so far, many stocks are also gaining investors’ confidence.
One such counter is Jubilant Ingrevia Limited which provides life science products and solutions in India and internationally via three segments: Specialty Chemicals, Nutrition & Health Solutions, and Chemical intermediates. The company has a market capitalization of INR 7,765 crore and trades at a TTM P/E ratio of 37.7.
First checking the financial health of the company, InvestingPro has given a 3 out of 5 rating which satisfies the minimum criterion of adding any stock to the portfolio. This health check is done by taking over 100 parameters into consideration, therefore the robustness of it helps to keep junk stocks out of the portfolio.

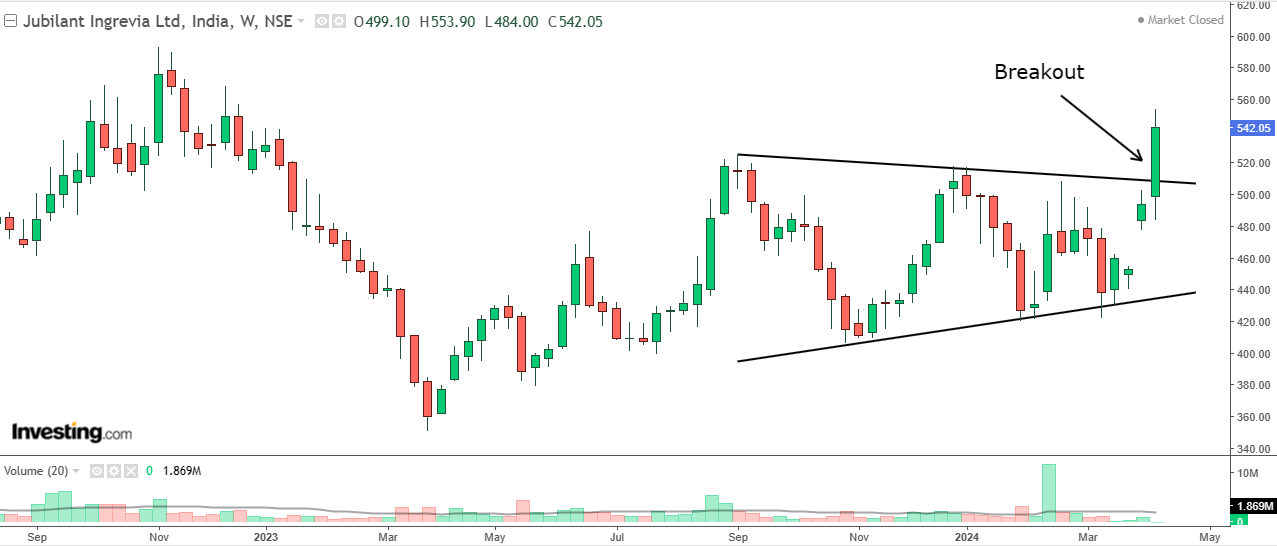
Image Description: Weekly chart of Jubilant Ingrevia with volume bars at the bottom
Image Source: Investing.com
Now coming to the technical setup, the stock had been consolidating in a range for some time. The range was narrowing in nature, meaning every successive rally and fall was shorter than before, marking a lower high and lower low formation on the chart.
This formation is the classic representation of a symmetrical triangle pattern which denotes volatility contraction in the underlying security. This makes up for a good reason for an impending die to mean reversion nature of volatility, meaning it reverts back to a high volatility zone sooner or later.
Today, the stock jumped 10.2% to INR 542, breaking the falling trendline resistance of the triangle pattern. This is a bullish signal and it is now dictating the impending trend which is obviously towards the north.

As per the height of the triangle, the stock can now make its way up to INR 620 – INR 625, depicting a decent upside potential of around 15%. A retest to the breakout level (if happens) can provide a better risk-adjusted entry on the long side. Once the stock falls back below the breakout level, the sustainability of the rally becomes questionable.

You can use the financial health score as the first line of check to keep your portfolio free from any bad stock. There are other useful features such as fair value – which gives the true intrinsic value of the stock, ProTIps – which helps investors stay informed with bite-sized information, etc. You can use all such features now at a steep discount of up to 69% or INR 216/month. Click here to try out this industry-grade revolutionary tool for retail investors.
This article discusses a stock’s price movement and a potential future trend based on a technical analysis indicator called a “symmetrical triangle breakout.” Here’s a breakdown of the key points:
- The Breakout: The article describes a 10.2% increase in an unnamed stock’s price. This price increase signifies a breakout from the trendline resistance of a symmetrical triangle pattern.
- Symmetrical Triangle Pattern: This is a chart pattern formed by price movements creating a triangle shape with a horizontal top and bottom line that converge as the price moves forward. It indicates a period of consolidation or indecision in the market.
- Bullish Signal: The breakout from the upper trendline of the triangle is considered a bullish signal, suggesting a potential price increase in the future.
- Target Price: The article estimates a possible price increase of 15% for the stock, reaching a target range of INR 620- INR 625. This estimation is based on the height of the triangle pattern.
- Entry Point: A retest of the breakout level (the price at which the stock broke out of the triangle pattern) is considered a good entry point for buying the stock, offering a better risk-adjusted return. However, if the price falls below the breakout level, the uptrend’s sustainability becomes questionable.
Important to Consider:
- This analysis is based on technical indicators and historical price movements. It’s not a guaranteed prediction of future stock performance.
- Fundamental analysis, which considers a company’s financial health, future prospects, and overall market conditions, is also crucial for making informed investment decisions.
Do you want to know more about technical chart patterns or fundamental analysis for stock selection?